Today I’m going to show how to make an nice map visualization of the Facebook Penetration numbers per country using Google Spreadsheets.
For this I am going to explain how to use the ImportHTML function of Google Docs and show you a quick, but very useful, way to create beautiful maps.
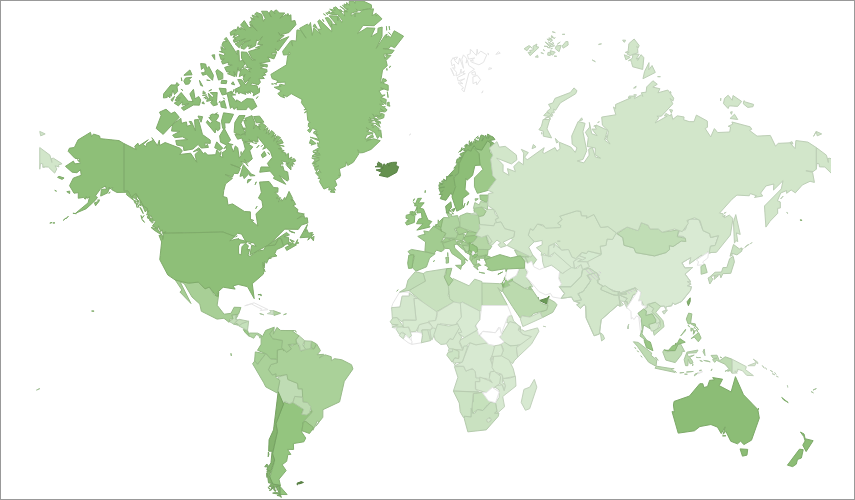
Don’t worry, we only need to perform 4 simple steps to get a nicely looking, informative result like shown here and in this Google Spreadsheet.
Step 1: Create a new Google Spreadsheet
Go to Google Drive and create a new spreadsheet. Pretty easy, right?
Step 2: Find some Facebook Usage numbers
Next, we need some data on the number of users on Facebook for each country. Luckily, socialbakers.com is keeping track of these numbers by looking at the official Facebook Ad Tool and calculating the penetration percentage per country. Take a look for yourself and you will see that there are five pages with almost all the countries in the world. Let’s use the importHTML function to import these numbers into our spreadsheet.
Step 3: Use ImportHTML to collect Facebook Usage numbers
ImportHTML() is a nifty function you can use to import certain parts of a website. Basically it loads a webpage and lets you specify which <table> or list element (<ul>, <ol>) you want to import. For this to work properly, you need to provide the function with three arguments.
- Specify the URL that you want to scrape – in our case socialbakers.com/facebook-statistics/.
- Specify if you want to import a table or a list element – in our case the data we want is formatted in a “table” HTML element
- Specify the index number of the element you need – in our case there is only one table so we specify “1”
TIP: To know in what type of HTML tag the data is formatted, you can use Firebug. If you are in Chrome you can right click on a number in the table and select “inspect element”.
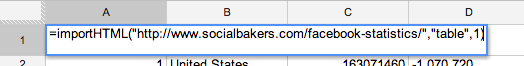
Now that we know how the ImportHTML function works, let’s add it to our spreadsheet. Select Cell A1 on your sheet and input the following formula: =importHTML("www.socialbakers.com/facebook-statistics/";"table";"1").
After waiting for a couple of seconds look what happens:
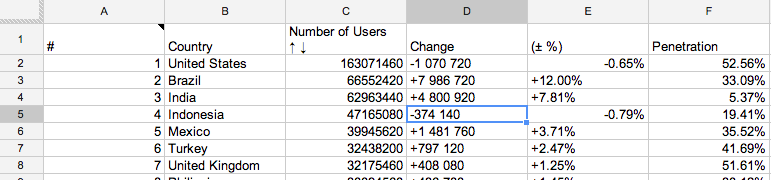
Isn’t that cool?
However, we now only have the first 50 countries of SocialBakers. To get the data for the remaining countries, we can perform the same trick with importHTML – we just need to use the URL’s of the other pages. If you look closely, going to page two changes the url to www.socialbakers.com/facebook-statistics/page-2.
Again, the data on this page is in the first table tag. Knowing this, we can now add the importHTML() function for each page under the result of the other.
So go to row 51 in your sheet and add =importHTML("www.socialbakers.com/facebook-statistics/page-2/";"table";"1") to Cell A51.
Repeat this for page three, four and five as well and we have a spreadsheet with Facebook usage numbers for 221 countries!
Step 4: Make a Google Spreadsheet Map chart to visualize the numbers per country
Having done all the heavy lifting in the previous step, we now only need to visualize our numbers into a nice world map. To do this, select a cell somewhere on the right side of the data and press the “create graph” icon.
For our purposes, lets graph the penetration percentage per country as that will make is easy to compare amongst countries.
- Press “select range” and click on the column country to select all countries. Then press “Add another range” and click on the penetration column to select all penetration values.
- Now go to the next tab Charts and select the graph type Map > Geo chart regions.
- Now you can go to the third tab to select the color scheme you want to use. Play around with it a bit for yourself to find the colors you like.
When you’re done, press the blue Insert button and the map will be added to your spreadsheet!
That’s it – I hope you liked this tutorial!
If you want to see the example in action, check out this Google Spreadsheet.
As you understand, you can use this technique to scrape and visualize tons of other information as well. Let me know in the comments what you came up with!

Hi! Really enjoy your posts and how articulated the examples are. I was wondering how can one make the map look closer to this one:
https://developers.google.com/experts/
Unfortunately there’s no way to change how the map looks as far as I know.
Actually, I found a way to do it, and implemented it for a website I maintain for the Alumni of my undergrad School:
http://www.semfealumni.gr/
It uses “Awesome Tables”, an awesome Google App : )