In this tutorial I will show you how to use some of Excel’s very useful statistical functions. If you’re doing any data analysis work for your job, I’m sure you’re going to use these a lot.
AVERAGE function
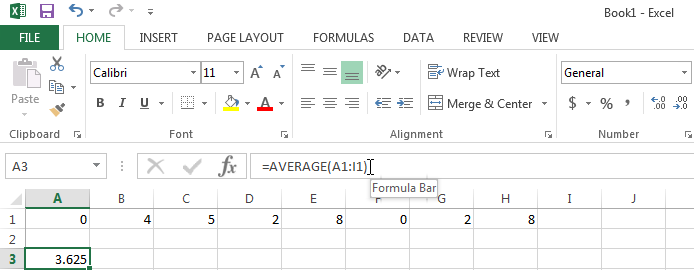
Use the AVERAGE function to calculate the average of a range of cells. To do this simply insert the function and select the range of cells of which you want to find the average.
AVERAGEIF function
Use the AVERAGEIF function to calculate the average of a range of cells based on one criteria. To do this simply insert the function and select the range of cells containing data.
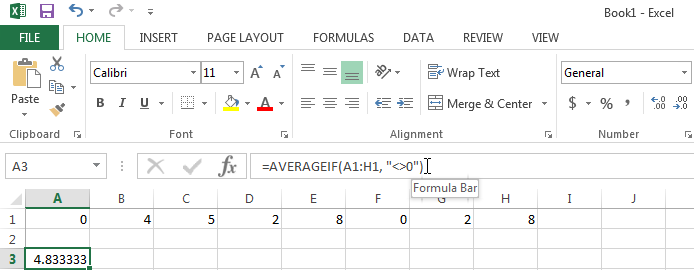
In the example I use the logical operator <> which means ‘not equal to’.
Additionally next to AVERAGE and AVERAGEIF you can also use the AVERAGEIFS functions to select an average based on multiple criteria – simply add more arguments with criteria to the function.
MEDIAN function
If you want to find the median of a range of cells (the middle number value) then you should use the the MEDIAN function. To do so simply insert the function and select the range of cells containing data.
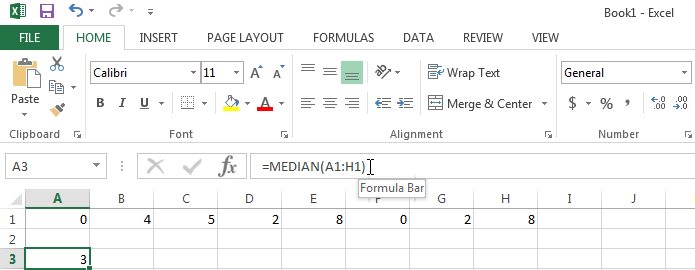
The number 3 means that half of the numbers in the selected range are higher than 3, and half of them lower than 3.
MODE function
In case you find the most frequently occurring number in a range of cells, you should us the MODE function. To do this simply insert the function and select the range of cells containing data.
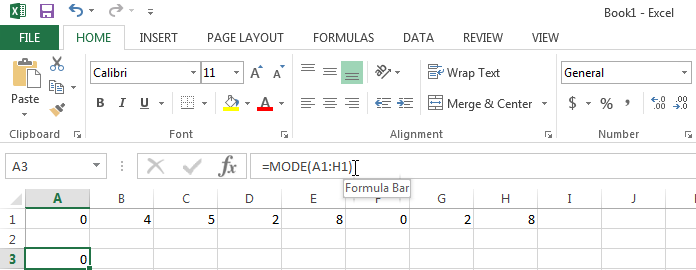
The 0 number shows that the number 0 is occurring most often in the selected range.
Standard Deviation function
A well-known concept in statistics is that on of standard deviation. If you want to get it from a range of cells, use the STEDV.P function. To do this simply insert the function and select the range of cells containing data.
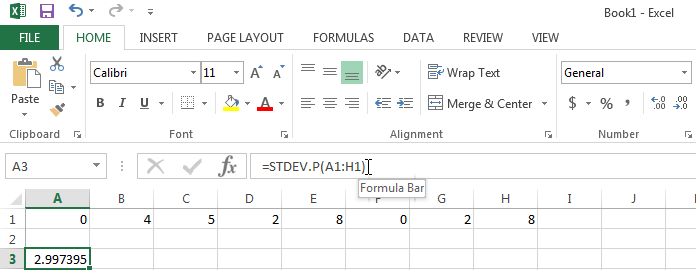
Note that Excel offers various standard deviation functions.
STDEV.P: Calculates standard deviation based on the entire population given as arguments.STDEV.S: Estimates standard deviation based on a sample.STDEVA: Estimates standard deviation based on a sample, including logical values and text.STDEVPA: Calculates standard deviation based on the entire population, including logical values and text.
For more information on what standard deviation means exactly, check out more on this topic on wikipedia.
MIN function
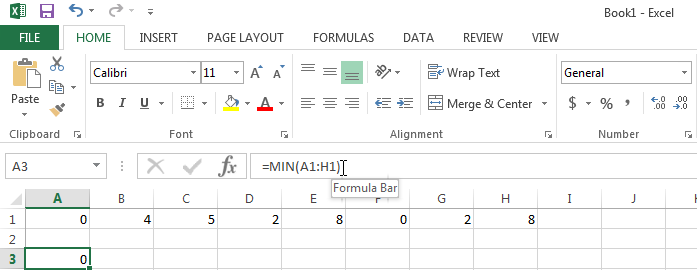
Use the MIN function to find the minimum value in a range of cells. To do this simply insert the function and select the range of cells containing data.
MAX function
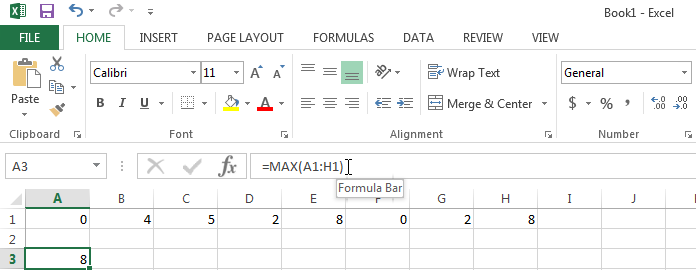
Use the MAX function to find the maximum value in a range of cells. To do this simply insert the function and select the range of cells containing data.
LARGE function
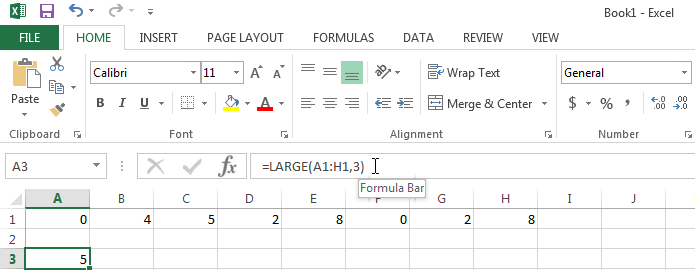
Use the LARGE function to find the 2nd or 3rd largest number in a range of cells for example. To do this simply insert the function, select the range of cells, and which number value you want to find (2nd largest, 3rd largest, etc).
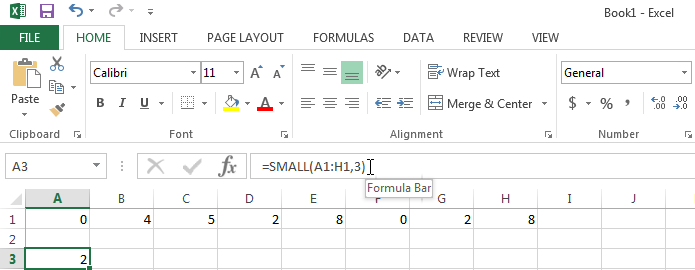
SMALL function
Use the LARGE function to find the 2nd or 3rd largest number in a range of cells for example. To do this simply insert the function, select the range of cells, and which number value you want to find (2nd largest, 3rd largest, etc).
A very long lesson this time, so I’m sure you have some questions! Let me know in the comments below and I’ll get back to you as soon as I can.

Speak Your Mind