Have you ever had to find the cell whose value did not match those of other cells in the same row?
Rather than checking manually, Excel Row Differences allows you to quickly find cells in rows that are different than the others. This function is especially useful in large workbooks with many different sets of data.
Find different values in a row
Perform the following steps to use the Row Differences functionality.
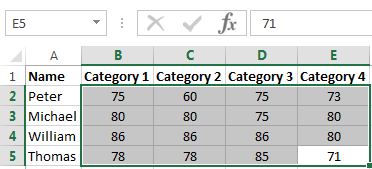
1. Highlight the range of cells of which the data has to be processed. Note that we are not including the cells from column A since those cells have information that does not need to be compared.
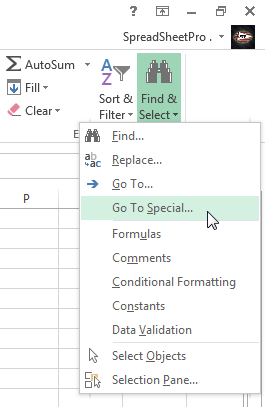
2. Select the Find & Select option on the far-right of the Home tab and click on Go To Special.
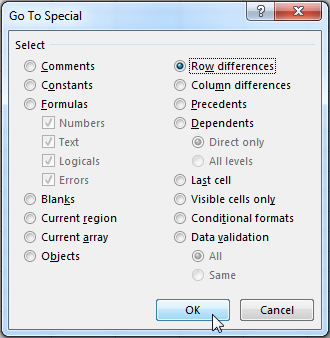
3. Select the Row Differences option in the Go To Special dialog box and click OK.
You will be redirected to your workbook and the cells whose values are different from those in the same row will be selected.
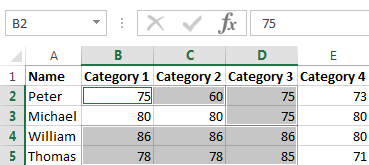
4. Change the background color of the selected cells by going to the Home tab and selecting the Fill Color option in the Font section of the ribbon.
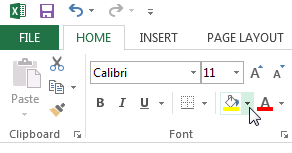
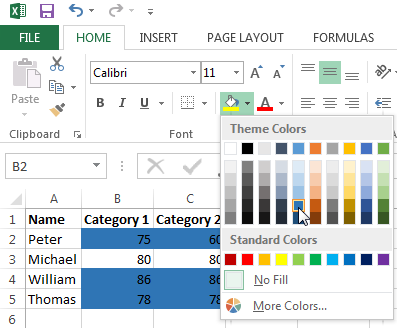
All cells with the same value as other cells in the same row will now be highlighted with the color you selected.
Find different values in columns
Of course, you can do the same for finding differences in columns. To do that, follow the same steps as above, but in step 3 instead of choosing Row differences, now choose Column differences.
Again, you then select all the values that are different in the column and you can give them another background color for example.
If you have any questions about this, feel free to let me know in the comments. I’m happy to help!

hi dear,
Actually i want to convert xml file in excel, it was done but all data in one cell how i will do it on differentiate in row and col
I am trying to a sheet where I can see the difference over time but on my iPad. How can I do this