Almost everybody that owns a website uses Google Analytics to analyze their visitor’s behaviour. While the Google Analytics web interface is useful, sometimes you just need a little more flexibility with your data by exporting it from Google Analytics into your spreadsheets.
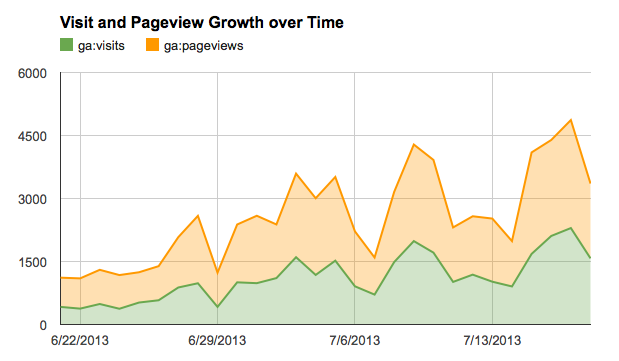
In this post I will show you how you can set up a spreadsheet that allows you to import Google Analytics data with the push of a button and make custom graphs about your visitors like this:
1. Add the Analytics Google Apps Script
Go to Google Docs and open a new spreadsheet by pressing Create > Spreadsheet.
Don’t worry, you don’t need to be able to program for this to work, just follow these simple steps:
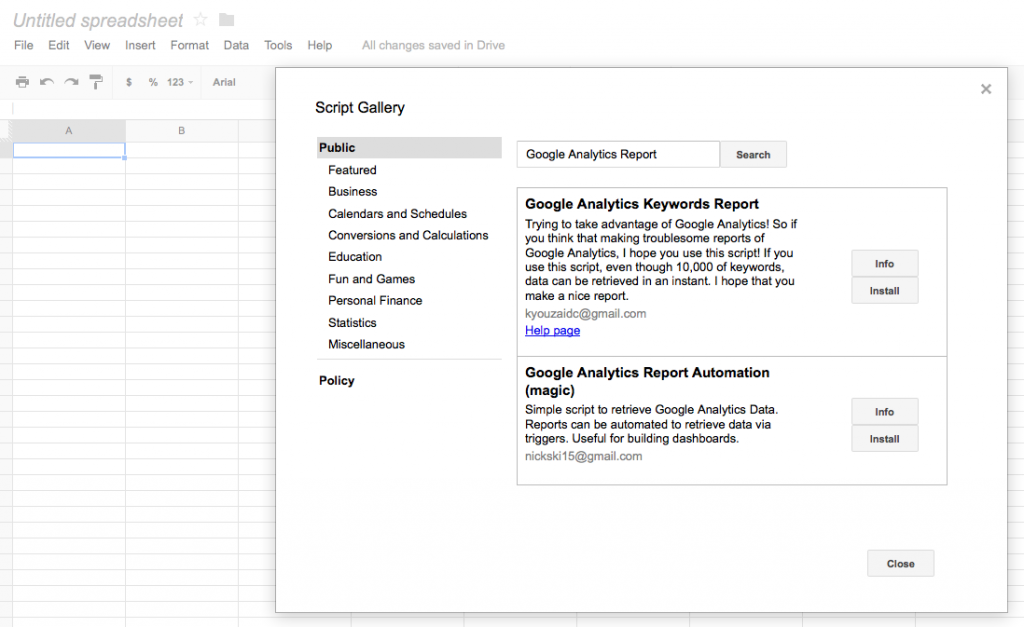
- In the new spreadsheet, click on
Toolsand thenScript Gallery - Search for “Google Analytics Report”
- Locate the script named “Google Analytics Report Automation (magic)” and press
Install - In the popup that follows press
Authorize
2. Activate access to Google Analytics
You just installed a Google Apps Script that is able to import your Google Analytics data into your spreadsheet. For it to work, you need to enable access to your Google Analytics first. For this you need to add a API key that tells the script where it can get your data. Simply do this:
- In the top menu press
Tools > Script editor - Click
Resources > Use Google APIsin the new window that has opened - In the popup that opens, toggle the button after Analytics API to
On
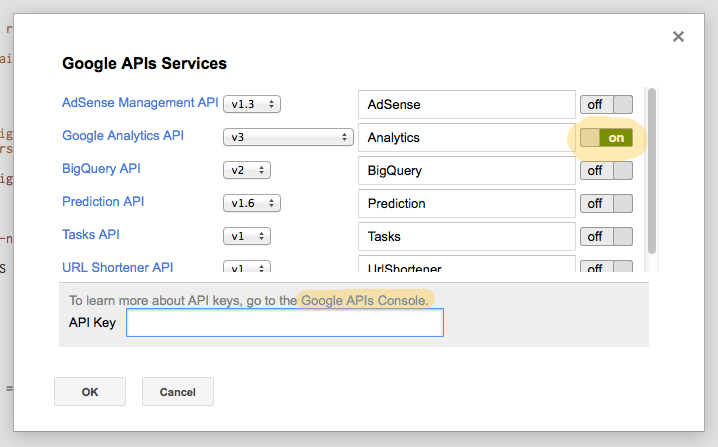
- Press the
Google APIs Consolelink at the bottom - If you haven’t done already press “Create new project” in the next window
- Click
Serviceson the left and toggle the button behind Google Analytics toOn
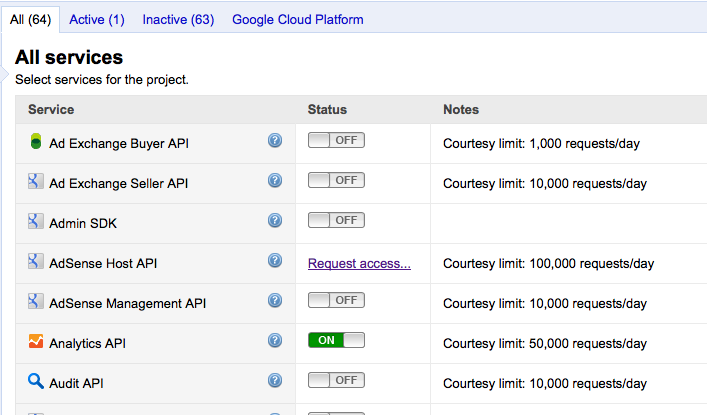
You have now succesfully authorized the script to access you Google Analytics data!
3. Make a Google Analytics query configuration
Now go back to the spreadsheet and refresh your browser. Wait for a couple of seconds after the page has loaded and notice that a sheet named gaconfig has been added and an extra option in the top menu has been created called Google Analytics.
To get data from Google Analytics, you have to tell the script what data it should import. The gaconfig sheet is the place to do this.
- To add a query configuration press
Google Analytics > Create Core Reportin the top menu.
An empty configuration has now been added to the gaconfig sheet – don’t worry we only need to fill in a couple of fields. In this case, let’s make a query for the amount of visits and pageviews from Google Analytics for the last 30 days:
- In the first field
ids, you specify the Google Analytics property ID you want to query. To get your ID, pressGoogle Anaytics > Get Profile IDsin the top menu - Press
Grant Accessto allow the script to run (you only have to do this once). Now pressGet Profile IDsagain - Now select the Account, Web Property, and Profile you want to query and copy the id that starts with “ga:<some_number>”
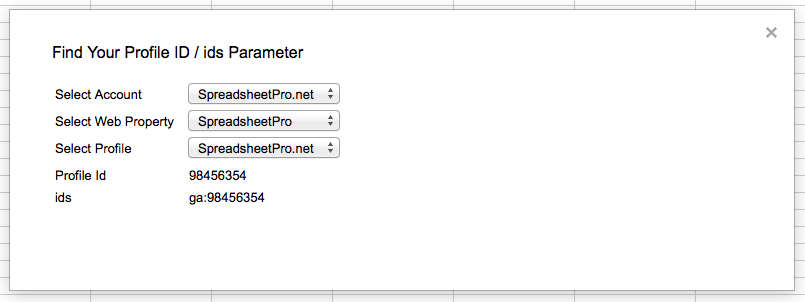
- Now paste that ID into the cell to the right of the
idscell - Type
30in the cell to the right of “last-n-days” - Type
ga:visits,ga:pageviewsin the cell to the right of “metrics” - Type
ga:datein the cell to the right of “dimensions” - Give the sheet on which the data will be imported a name in the cell next to “sheet-name”
We’re almost there! Your query configuration should look something like this now:
| query1 | value1 |
|---|---|
| type | |
| ids | ga:98456354 |
| start-date | |
| end-date | |
| last-n-days | 30 |
| metrics | ga:visits,ga:pageviews |
| dimensions | ga:date |
| sort | |
| filters | |
| segment | |
| start-index | |
| max-result | |
| sheet-name | Google Analytics Data |
Tip:There are a lot of other metrics and dimensions you can make your query with. Also you can segment and filter your data just like you can in Google Analytics. For a full overview of functionality check the site from Google Analytics
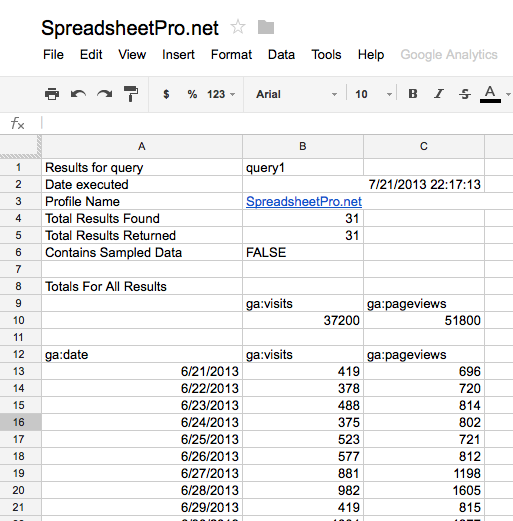
Finally, press Google Analytics > Get Data in the top menu and watch the script import Google Analytics data into your spreadsheet!
Once you have closed the popup, you will have a new sheet with the amount of visits and pageviews to your site for the last 30 days. Additionally some extra information is included that tells you when the query was made, how many results there are and whether sampling was applied.
That’s it! You have imported data from Google Analytics to Google Spreadsheets. You can now easily create graphs like this:
Think if all the cool stuff you can do with having your analytics data in Google Docs. As always, I’d love to hear what you have come up with in the comments.
Bonus Step: Automate the Google Analytics import

Even though it’s pretty cool that you have set up your spreadsheet to import data by pressing Get Data, it can be very valuable to let your script automatically import data on specific times, or when you open the spreadsheet for example.
Luckily this is very easily done by creating trigger that can run the Get Data command:
- Go to
Tools > Script editoragain - Press
Resources > Current project's triggers
You can create triggers based on events in your spreadsheet or based on time.
To automatically import data when you open the spreadsheet:
- Press
Add a new triggerand select thegetDatafunction under Run - Make sure the two other fields shows
from spreadsheetandOn open
To automatically import data each day:
- Press
Add a new triggerand select thegetDatafunction under Run - Make sure the two other fields shows
time-drivenandDay timer
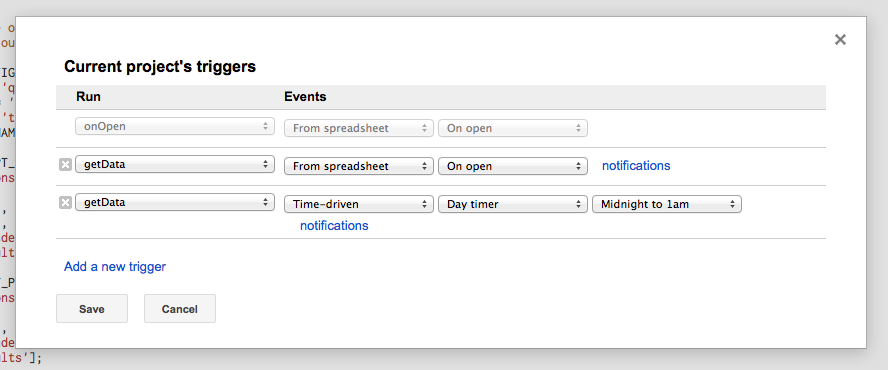
Saving these trigger, the spreadsheet will now automatically import your Analytics data every day around midnight and when you open the spreadsheet.
Using these triggers, you can create cool dashboards that are always up to date. Let me know when you have made some nice dashboards in the comments.

In the second step to activate access to google analytics, i’m not getting any option to enter the API key.
what should I do?
Thanks for your question! I remember one time it didn’t show for me either, after which it reappeared the next day.
Did you make sure that you first put the toggle button behind Google
Analytics to On? Also, you could try to go here directly:
https://code.google.com/apis/console/ and do the steps (creating a project and toggling GA API access on) after which the field might show. Otherwise it might be a case of
clearing your browser cache and trying to reload the page again. Let me know if it worked, or still doesn’t work – I’d love to help further!
Thanks a lot for replying.
I tried everything that you asked me to do but I still can’t see the text field to enter the API key..
Please let me know if I can do something else.
Thank you
Hi Prateek, Google has recently updated their process of API access which has made it a lot simpler. From now on you don’t have to copy-paste the key in that field anymore – that is why it is not there.
I updated this post, if you follow all steps now it should work. Let me know if you got it to.
First of all, thanks for the article.it s great.I have a big problem though. WHen I run Get Data from the menu I get this error…I must specify the analytics and drive APIs are open!! please help, tired everything!!
Running on: Tue Jul 08 2014 17:29:43 GMT+0100 (BST)
Found 1 report configurations.
Executing query: query1
Error executing query1: Access Not Configured. Please use Google Developers Console to activate the API for your project.
Script done
Hi! Interesting, I added a spreadsheet with these functions now.
I am trying to accomplish something a bit more advanced though, I am having a list of internal urls in a column, and in the column next to it I would like to have the total amount of people that have landed on that url the last 30 days. Any ideas of where I should start?
Hello, I’m actually trying to accomplish the same thing. I am able to
get the general reporting done but hoping to create a report for just
specific urls. The idea is to keep adding urls in one column and pull
the traffic data from GA.
Has anyone been able to accomplish this?
Thanks!
I’m trying to do this as well, have you succeeded?
I’ve been using this aps script for a while but when revenue data is beeing extracted, the numbers are not in the right format, they come as a string and in addition to this when the amount is greater than 9mill, the result is even worse (ex: 1.1512202E7)
we managed to make some changes in the script so that all numbers show in the right format (not as a string) so that you can add further formatting like decimals or type of currency
now we got stuck into sums which are equal or above 10mill as mentioned above
any clues?
Great overview and post! Once I set this up it was easy for me to put in DataHero (https://datahero.com/blog/2014/04/10/automate-google-analytics-reporting-with-datahero/) to have it automatically update in a gorgeous dashboard. Thanks for the great guide!
There is no getData function for me. Please help, how to make that one. I can only see the readRows and onOpen functions. I can not automate the report like this. Is this post too old and it is not avaible any more or what? Please help me.
Also had the same problem like Phil Amery. How can we solve that one?
Hey Adam,
For us it’s still working. Are you sure added the script properly and didn’t change any code?
Also: are you using the old or new google spreadsheets? Do you see the getData function when you are in the code editor?
I dont see the getData function. I didnt change the code, but in the basic code i didnt get the getData function, thats why i cant set a trigger for it. I attached he code i got now in the script editor. Please tell me what to write in it exactly to get it working.
Thank you very very much!
What if i would like to get counter of specific urls?
Say I’ll enter the urls of my posts from A3 and want to get total hits of A3’s url in B3
and it will continue to get all link hits in column B serially
Hi, I’m trying to do the exact same thing – did you find a way? Thanks
I want the report to be generated automatically by 1st of every month. How can i get the month report since the days will be differ in an alternative manner.
I think your banner would look more professional if you stopped using Neil Patel’s catchphrases and invent your own. Also, the article needs to be updated, because there is no “Script Gallery” item in Google Sheets any more.